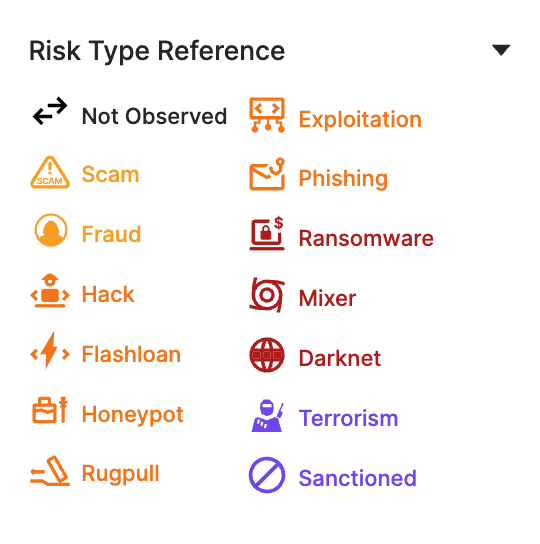
Legend
- The legend is a key tool in the visualization as it provides guidance on the icons used to identify risk. The colors used in the visualization also reflect the level of risk, where black indicates no risk, orange indicates low to medium risk, red indicates high risk, and purple indicates a very high or critical risk category.

